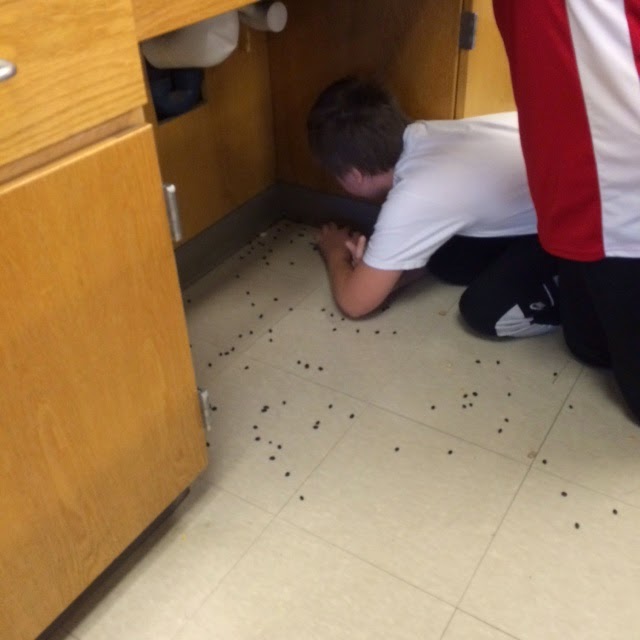
Once I took a closer look and started talking to some of the students, I realized the valuable learning that was occurring and the deep understanding that was a result of it. Students were doing a population study, where each type of bean represented a species. Interestingly, the class's floor is made of square linoleum tiles, making for a perfect grid.
Students count the number of different types of beans in fifty randomly selected grids on the floor of the classroom. Students compile their results on a Google spreadsheet and calculate the average number of each type of bean per grid. Next, they devise their own methods to determine the total number of grids in the classroom and use this number to estimate the total populations of each type of bean in the classroom. Lastly, students graph the total populations on a bar graph.
When pressed by me for greater understanding, students were able to relate how greater densities of beans in some tiles may correlate to a high density of organisms in an area with a high number of natural resources for survival. Students were also able to draw conclusions why cities may have large populations versus more rural areas.